Retail Analysis with Walmart Sales Data
1 Project Description
1.1 Problem Statement
Historical sales data for 45 Walmart stores located in different regions are available. There are certain events and holidays which impact sales on each day.
Holiday events
- Super Bowl:
12-Feb-10,11-Feb-11,10-Feb-12,8-Feb-13 - Labour Day:
10-Sep-10,9-Sep-11,7-Sep-12,6-Sep-13 - Thanksgiving:
26-Nov-10,25-Nov-11,23-Nov-12,29-Nov-13 - Christmas:
31-Dec-10,30-Dec-11,28-Dec-12,27-Dec-13
1.2 Basic Statistics Tasks
- Which store has maximum sales
- Which store has maximum standard deviation i.e., the sales vary a lot. Also find out the coefficient of mean to standard deviation
- Which store(s) has good quarterly growth in Q3` 2012
- Some holidays have a negative impact on sales. Find out holidays which have higher sales than the mean sales mean sales in non-holiday season for all stores together.
- Provide a monthly and semester view of sales in units and give insights
1.3 About the data
Store- The store number from 1 to 45Date- Week of the sales(date)Weekly_Sales- Sales for the given storeHoliday_Flag- Whether the week is a special holiday or not(1-Holiday week, 0- Non-holiday week)Temperature- Temperature on the day of saleFuel_Price- Cost of fuel in the regionCPI- Prevailing consumer price indexUnemployment- Prevailing unemployment rate
library(tidyverse)
library(here)
library(ggthemes)
library(scales)
library(lubridate)
Let’s read in our data
retail<-read_csv(here("walmart.csv"))2 Data Exploration
dim(retail)[1] 6435 8- Our data has 6435 observations and 8 variables.
rmarkdown::paged_table(retail)str(retail)spec_tbl_df [6,435 x 8] (S3: spec_tbl_df/tbl_df/tbl/data.frame)
$ Store : num [1:6435] 1 1 1 1 1 1 1 1 1 1 ...
$ Date : chr [1:6435] "05-02-2010" "12-02-2010" "19-02-2010" "26-02-2010" ...
$ Weekly_Sales: num [1:6435] 1643691 1641957 1611968 1409728 1554807 ...
$ Holiday_Flag: num [1:6435] 0 1 0 0 0 0 0 0 0 0 ...
$ Temperature : num [1:6435] 42.3 38.5 39.9 46.6 46.5 ...
$ Fuel_Price : num [1:6435] 2.57 2.55 2.51 2.56 2.62 ...
$ CPI : num [1:6435] 211 211 211 211 211 ...
$ Unemployment: num [1:6435] 8.11 8.11 8.11 8.11 8.11 ...
- attr(*, "spec")=
.. cols(
.. Store = col_double(),
.. Date = col_character(),
.. Weekly_Sales = col_double(),
.. Holiday_Flag = col_double(),
.. Temperature = col_double(),
.. Fuel_Price = col_double(),
.. CPI = col_double(),
.. Unemployment = col_double()
.. )
- attr(*, "problems")=<externalptr> summary(retail) Store Date Weekly_Sales Holiday_Flag
Min. : 1 Length:6435 Min. : 209986 Min. :0.00000
1st Qu.:12 Class :character 1st Qu.: 553350 1st Qu.:0.00000
Median :23 Mode :character Median : 960746 Median :0.00000
Mean :23 Mean :1046965 Mean :0.06993
3rd Qu.:34 3rd Qu.:1420159 3rd Qu.:0.00000
Max. :45 Max. :3818686 Max. :1.00000
Temperature Fuel_Price CPI Unemployment
Min. : -2.06 Min. :2.472 Min. :126.1 Min. : 3.879
1st Qu.: 47.46 1st Qu.:2.933 1st Qu.:131.7 1st Qu.: 6.891
Median : 62.67 Median :3.445 Median :182.6 Median : 7.874
Mean : 60.66 Mean :3.359 Mean :171.6 Mean : 7.999
3rd Qu.: 74.94 3rd Qu.:3.735 3rd Qu.:212.7 3rd Qu.: 8.622
Max. :100.14 Max. :4.468 Max. :227.2 Max. :14.313 We take a look at our variable of interest for this project:
Weekly_Sales
retail%>%ggplot(aes(x=Weekly_Sales))+geom_histogram(fill="royalblue",color="black")+theme_fivethirtyeight()+labs(x="Weekly Sales",y="Frequency")+scale_x_continuous(breaks = (seq(from=0,to=4000000,by=1000000)),labels = scales::label_number_si())+labs(title="Weekly Sales Histogram Plot")+theme(plot.title = element_text(family="sans",size=20,hjust=0.5),axis.title = element_text(size=12.5))
- Weekly Sales is positively skewed. This could be due certain holidays causing an increase in sales. Therefore, we won’t try to fix this skewness since, it might help us shed light in our analysis(which holidays cause a peak in sales, etc.).
3 Data cleaning
Checking for missing values
sum(is.na(retail))[1] 0Checking for any duplicates in our data
sum(duplicated(retail)==TRUE)[1] 04 Question One
Which store has maximum sales
max.sales<-retail%>%group_by(Store)%>%summarize(sum=sum(Weekly_Sales))%>%arrange(desc(sum))
max.sales[1,]
# A tibble: 1 x 2
Store sum
<dbl> <dbl>
1 20 301397792.4.1 Answer
[1] "Store no. 20 has the maximum sales with 301397792.46"max.sales%>%ggplot(aes(x=reorder(Store,-sum),y=sum,fill=ifelse(Store=="20",'tomato','grey54')))+geom_col()+scale_fill_identity()+labs(title ="Stores vs Sales",y="Total Sales",x="Store no.")+scale_y_continuous(labels=scales::label_number_si())+theme_fivethirtyeight()+theme(legend.position = "none",plot.title = element_text(hjust = 0.5,size=20),axis.title = element_text(size=12.5),axis.text = element_text(size=9.5))
5 Question Two
Which store has maximum standard deviation i.e., the sales vary a lot. Also find out the coefficient of mean to standard deviation
max.sd<-retail%>%group_by(Store)%>%summarize(std.dev=sd(Weekly_Sales),mean=mean(Weekly_Sales))%>%mutate(coef=(std.dev/mean)*100)%>%arrange(desc(std.dev))
max.sd[1,]
# A tibble: 1 x 4
Store std.dev mean coef
<dbl> <dbl> <dbl> <dbl>
1 14 317570. 2020978. 15.75.1 Answer
[1] "Store no. 14 has the maximum standard deviation of 317569.9 and coefficient of variation is 15.7137"max.sd%>%ggplot(aes(x=reorder(Store,-std.dev),y=std.dev,fill=ifelse(Store=="14",'tomato','grey54')))+geom_col()+scale_fill_identity()+labs(title ="Stores vs Standard Deviation",y="Standard Deviation",x="Store no.")+scale_y_continuous(labels=scales::label_number_si(),breaks = seq(from=0,to=300000,by=75000))+theme_fivethirtyeight()+theme(legend.position = "none",plot.title = element_text(hjust=0.5,size=20),axis.text.y = element_text(size=9.5),axis.text.x = element_text(size = 9.5),axis.title = element_text(size=12.5))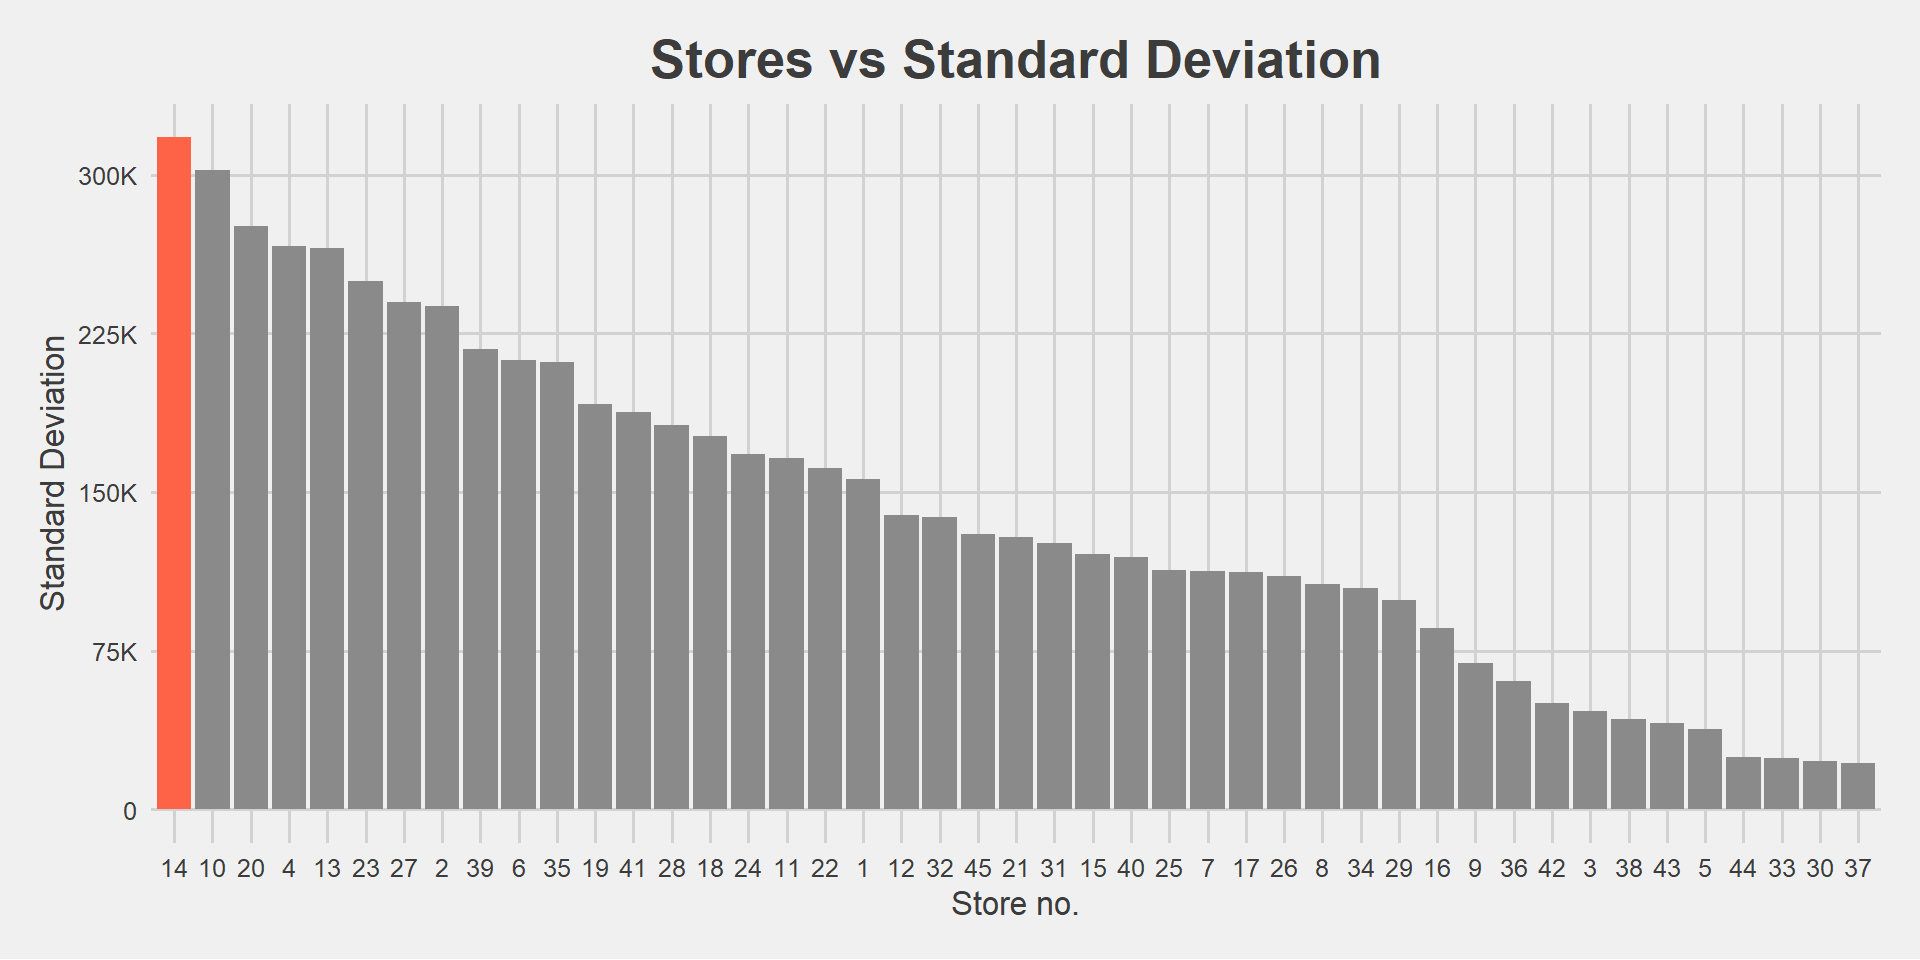
retail%>%filter(Store==14)%>%ggplot(aes(x=Weekly_Sales))+geom_density(color="Royalblue",fill="lightblue",size=1)+theme_fivethirtyeight()+labs(title="Sales Distribution for Store no. 14",y="Density",x="Weekly Sales")+geom_vline(aes(xintercept=mean(Weekly_Sales)),color="steelblue",size=1,linetype="dashed")+theme(plot.title = element_text(hjust=0.5,size=20),axis.title = element_text(size=12.5))
6 Question Three
- Which store(s) has good quarterly growth in Q3` 2012
We first extract the months and date and store them in a new column
month-yr
retail$month_yr<-format(as.Date(retail$Date,format = "%d-%m-%Y"),"%Y-%m")We then filter out Q3’ 2012 and Q2’ 2012.
Q3.2012<-retail%>%filter(month_yr=="2012-07" | month_yr=="2012-08" | month_yr=="2012-09")

Q2.2012<-retail%>%filter(month_yr=="2012-04" | month_yr=="2012-05" | month_yr=="2012-06")
We group the data by store, getting the sum of each store.
Q3.2012.Sales<-Q3.2012%>%group_by(Store)%>%summarise(sumQ3=sum(Weekly_Sales))

Q2.2012.Sales<-Q2.2012%>%group_by(Store)%>%summarise(sumQ2=sum(Weekly_Sales))
We merge the two data sets by a common denominator, in this case
Store
We also create a new column growth_rate that measures
the quarterly growth in Q3` 2012.
We filter those stores with a positive growth rate and store them in a new data set called “positive_growth”.
Q3.2012.Growth<-merge(Q2.2012.Sales,Q3.2012.Sales,by="Store")%>%mutate(growth_rate=((sumQ3-sumQ2)*100)/sumQ2)

positive_growth<-Q3.2012.Growth%>%select(Store,growth_rate)%>%filter(growth_rate>0)%>%arrange(desc(growth_rate))knitr::kable(positive_growth)| Store | growth_rate |
|---|---|
| 7 | 13.3307760 |
| 16 | 8.4883781 |
| 35 | 4.4666372 |
| 26 | 3.9554775 |
| 39 | 2.4784040 |
| 41 | 2.4569801 |
| 44 | 2.4346377 |
| 24 | 1.6520877 |
| 40 | 1.1428413 |
| 23 | 0.8253951 |
6.1 Answer
[1] "Store no. 7 16 35 26 39 41 44 24 40 23 all had a good quarterly growth in Q3 2012 with store no 7 having the most growth"Q3.2012.Growth%>%ggplot(aes(x=as.factor(Store),y=growth_rate))+geom_col(fill=ifelse(growth_rate>0,"royalblue","#6699FF"))+theme_fivethirtyeight()+theme(axis.title = element_text(size=12.5),plot.title = element_text(hjust=0.5,size=20),axis.text.y = element_text(size=9.5),axis.text.x =element_text(size=9.5) )+scale_y_continuous(breaks = seq(from=-15,to=15,by=5 ))+labs(title="Q3' Quarterly Growth in 2012")+ylab("Growth rate")+xlab("Store no.")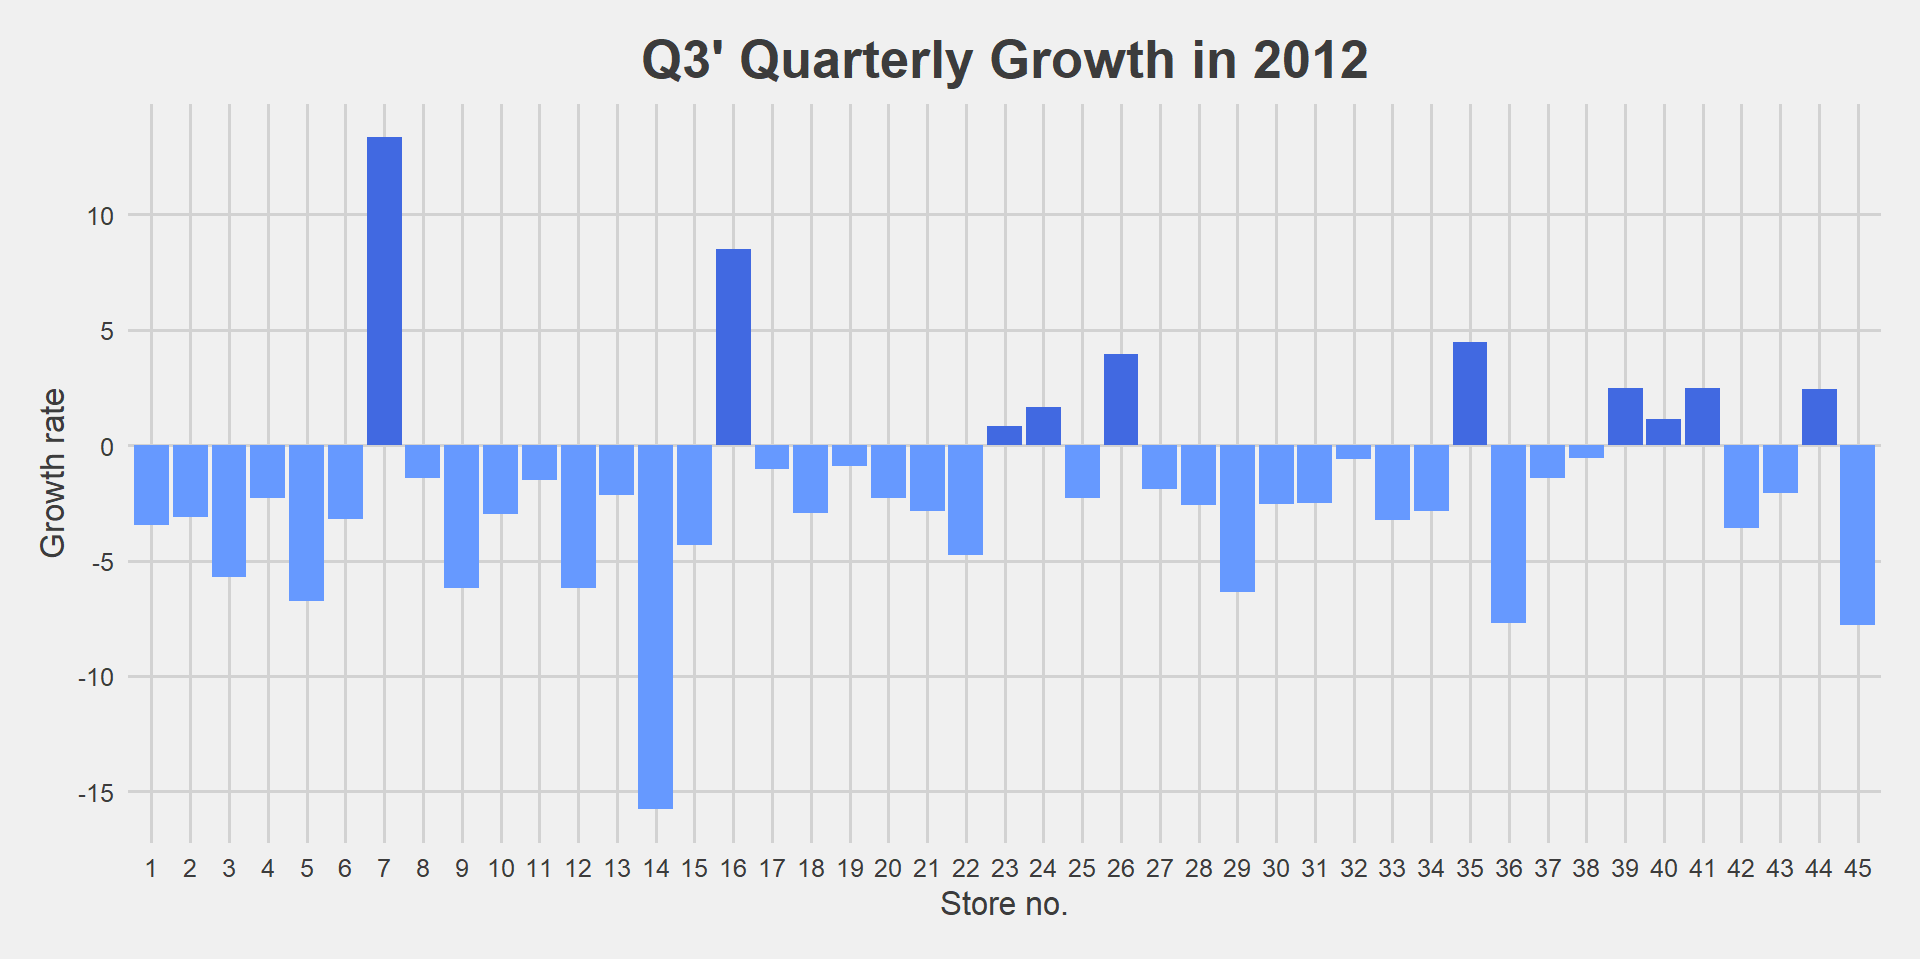
7 Question Four
Some holidays have a negative impact on sales. Find out holidays which have higher sales than the mean sales in non-holiday season for all stores together.
Lets create a new data set similar to our retail data set, with a new column made up of Holiday names mapped to their respective dates and save the non-holidays as “Non-Holiday”.
Date<- c("12-02-2010", "11-02-2011", "10-02-2012", "08-02-2013","10-09-2010", "09-09-2011",  "07-09-2012", "06-09-2013","26-11-2010", "25-11-2011", "23-11-2012", "29-11-2013","31-12-2010", "30-12-2011", "28-12-2012", "27-12-2013")

Holiday_Names<-c(rep("Super Bowl",4),rep("Labour Day",4),rep("Thanksgiving",4),rep("Christmas",4))

Holiday<-data.frame(Date,Holiday_Names)
Holiday_data<-merge(retail,Holiday,by.x="Date",all.x = TRUE,)

Holiday_data$Holiday_Names<-as.character(Holiday_data$Holiday_Names)

Holiday_data$Holiday_Names[is.na(Holiday_data$Holiday_Names)]="Non-Holiday"
Lets group by holiday name to find the mean of non holidays.
holiday_mean_data<-Holiday_data%>%group_by(Holiday_Names)%>%summarise(mean=mean(Weekly_Sales))
holiday_mean_data
# A tibble: 5 x 2
Holiday_Names mean
<chr> <dbl>
1 Christmas 960833.
2 Labour Day 1042427.
3 Non-Holiday 1041256.
4 Super Bowl 1079128.
5 Thanksgiving 1471273.The mean sales of non holidays is 1,041,256.4
- Lets see which holiday dates have a greater mean than the non holiday mean.
Holiday_Mean<-Holiday_data%>%group_by(Date,Holiday_Names)%>%summarise(mean=mean(Weekly_Sales))

Holiday_Mean$id<-ifelse(Holiday_Mean$mean>1041256   ,"TRUE","FALSE")

Greater_than_non_holidays<-Holiday_Mean%>%filter(id=="TRUE" & Holiday_Names %in% c("Christmas","Labour Day","Super Bowl","Thanksgiving"))
Greater_than_non_holidays
# A tibble: 6 x 4
# Groups: Date [6]
Date Holiday_Names mean id
<chr> <chr> <dbl> <chr>
1 07-09-2012 Labour Day 1074001. TRUE
2 10-02-2012 Super Bowl 1111320. TRUE
3 11-02-2011 Super Bowl 1051915. TRUE
4 12-02-2010 Super Bowl 1074148. TRUE
5 25-11-2011 Thanksgiving 1479858. TRUE
6 26-11-2010 Thanksgiving 1462689. TRUE 7.1 Answer
[1] "The holidays, 07-09-2012, 10-02-2012, 11-02-2011, 12-02-2010, 25-11-2011, 26-11-2010, all have higher sales than the mean sales in non-holiday season for all stores together."Holiday_Mean$Date<-as.Date(Holiday_Mean$Date,format="%d-%m-%Y")
Holiday_Mean%>%arrange(Date)%>%filter(Holiday_Names %in% c("Christmas","Labour Day","Super Bowl","Thanksgiving"))%>%ggplot(aes(x=as.factor(Date),y=mean,fill=factor(Holiday_Names)))+geom_col()+geom_hline(aes(yintercept=1041256.4 ),color="#333333",size=1,linetype="dashed")+labs(title = "Mean Sales vs Holidays",y="Mean Sales",x="Date")+theme_fivethirtyeight()+theme(axis.title.x = element_text(family = "sans",size=12.5),axis.title.y = element_text(family="sans",size = 12.5),legend.title = element_blank(),plot.title = element_text(hjust = 0.4,size=20))+scale_fill_manual(values=c("#FF9900","#FF6600","#009966","#6699FF"))+scale_y_continuous(labels = scales::label_number_si())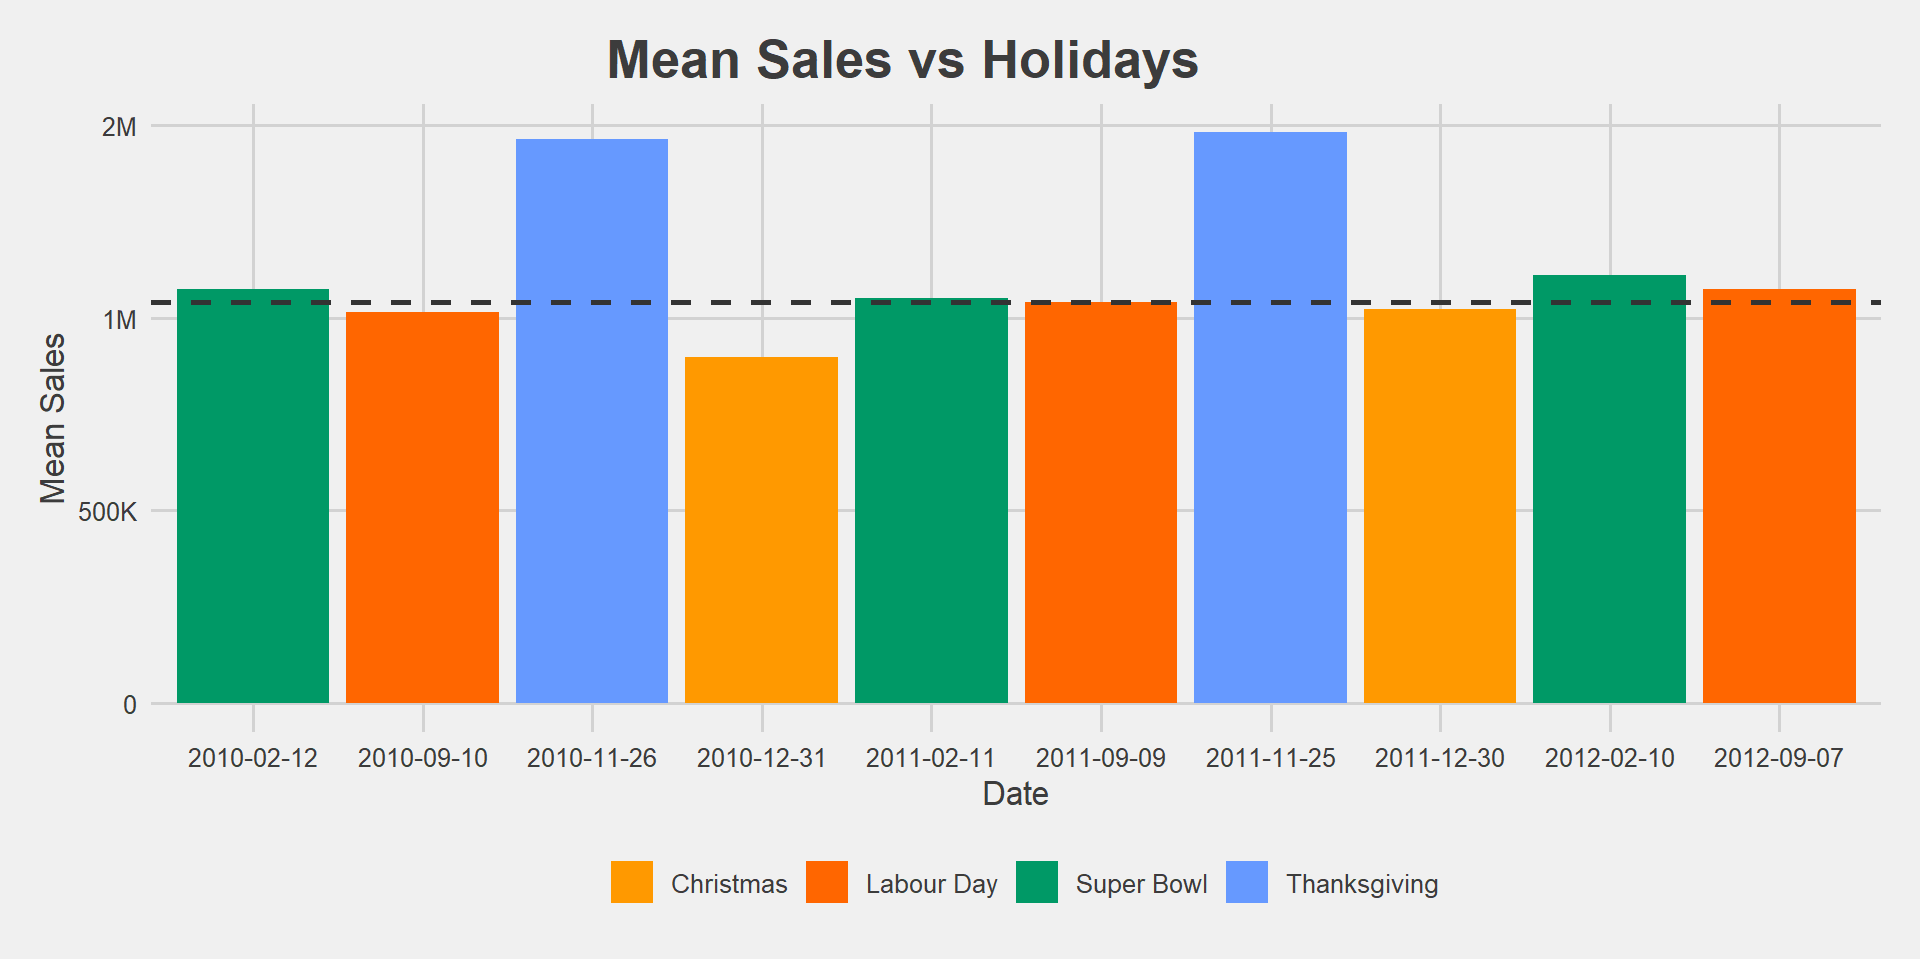
8 Question Five
Provide a monthly view of sales in units and give insights
8.1 Answer
monthly_view<-retail%>%group_by(month_yr)%>%summarise(sales_total=sum(Weekly_Sales))


monthly_view%>%ggplot(aes(x=month_yr,y=sales_total,group=1))+geom_line(color="Steelblue",size=1.2)+geom_point()+labs(title="Monthly View of Sales: 2010 to 2012",x="Months",y="Total Sales")+theme_fivethirtyeight()+theme(axis.title.x = element_text(family = "sans",size = 12),axis.text.x = element_text(angle = 60,family = "sans",size=9.5),axis.title.y = element_text(family="sans",size = 12),axis.text.y = element_text(size=9.5),plot.title = element_text(hjust = 0.5,size=20))+scale_y_continuous(labels = label_number(suffix="M",scale = 1e-6),limits = c(150000000,300000000))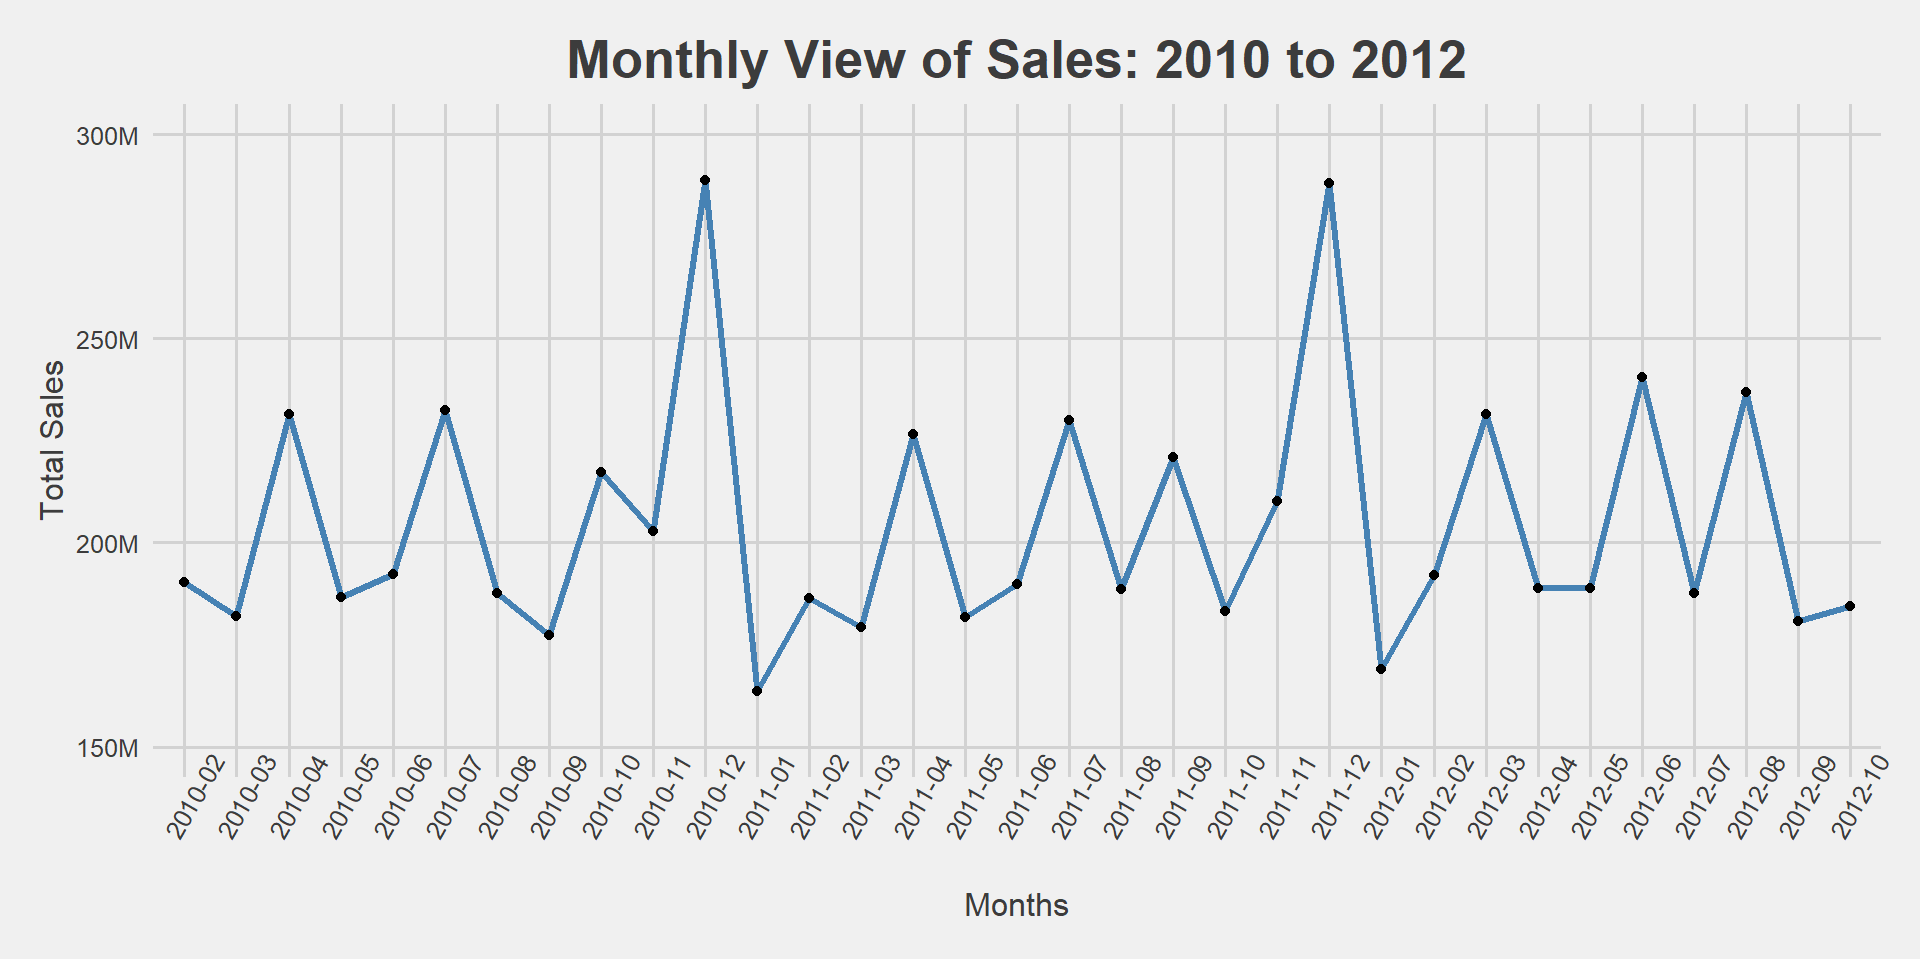
We can see a peak in sales in December of 2010 and 2011 and a drop in sales in January of 2010 and 2011.
The peak in sales around December may be due to sales increasing as people buy gifts, decorations and christmas supplies for the holidays.
The drop in sales in January may be due more people choosing to save after overindulging and splurging on the holidays.