Predicting Credit Card Cancellations (96.91% Accuracy)
1 Project Description
1.1 Problem Statement
A manager at the bank is disturbed with more and more customer leaving their credit card services. They would really appreciate if one could predict for them who is gonna get churned so they can proactively go to the customer to provide them better services and turn customers’ decisions in the opposite direction.
1.2 Goal of this Project
- Create a model that can accurately predict which customer will churn.
- Identify customer characteristics and behavioral aspects that are key in predicting customer churn.
1.3 About the data
This data set contains 10,000 customers mentioning their age, salary, marital_status, credit card limit, credit card category, etc.
I tried to divide the variables into the following segments that I thought would be useful in finding out which type of variables could predict credit churn.
Target Variable
Attrition flag- If the credit card subscription has been cancelled or not(“Attrited Customer”=it is cancelled, “Existing Customer”=it is not cancelled)
Demographic Variables
Customer age- Customer`s age in yearsGender- Customer`s gender (M=Male, F=Female)Dependent Count- Number of dependentsEducation Level- Education qualification of customer(high school, college, graduation, etc.)Marital Status- Married, single, divorced, unknownIncome Category- Annual income category of the account holder(< $ 40k, $ 40k-$ 60k, $60k-$80k, $80k-$120k, > $120k, Unknown)
Product Related Variables
Card category- Type of card(Blue, silver, Gold, Platinum)Credit Limit- Credit limit on the credit cardTotal Relationship Count- Total numbers of products held by the customer(cards, accounts, etc.)
Customer/Company Interaction Variables
Months on book- Period of relationship with bankContacts Count 12 mon- Number of contacts made between the bank and the customer in the last 12 months.Months Inactive 12 mon- Number of months inactive in the last 12 months.
Transaction Activity Variables
Avg Open To Buy- Open to buy credit line(Average of last 12 months)Total Amt Change Q4 Q1- Change in transaction amount by the customer comparing the 4th quarter against the 1st.Total Trans Amt- Total Transaction amount in the last 12 monthsTotal Trans Ct- Total Transaction CountTotal Transaction Count- Change in transaction comparing the \(4^{th}\) quarter against \(1^{st}\)Avg Utilization Ratio- Average credit card utilization ratio; the ratio of(credit card spent + money withdrawal)/(Total available limit for credit card spends + Total money withdrawal limit)Total revolving bal- Unpaid amount that the credit card holder does not pay in time and that is carried on to their next credit card’s cycle.
Loading our libraries
library(tidyverse)
library(here)
library(ggthemes)
library(caret)
library(smotefamily)
library(VIF)
library(scales)
library(treemap)
library(gridExtra)
library(grid)
library(corrplot)
library(xgboost)
Reading our data set
Bank<-read_csv(here("BankChurners.csv"))2 Data Exploration
dim(Bank)[1] 10127 21- Our data has 10,127 observations and 21 variables
rmarkdown::paged_table(Bank)summary(Bank) CLIENTNUM Attrition_Flag Customer_Age Gender
Min. :708082083 Length:10127 Min. :26.00 Length:10127
1st Qu.:713036770 Class :character 1st Qu.:41.00 Class :character
Median :717926358 Mode :character Median :46.00 Mode :character
Mean :739177606 Mean :46.33
3rd Qu.:773143533 3rd Qu.:52.00
Max. :828343083 Max. :73.00
Dependent_count Education_Level Marital_Status Income_Category
Min. :0.000 Length:10127 Length:10127 Length:10127
1st Qu.:1.000 Class :character Class :character Class :character
Median :2.000 Mode :character Mode :character Mode :character
Mean :2.346
3rd Qu.:3.000
Max. :5.000
Card_Category Months_on_book Total_Relationship_Count
Length:10127 Min. :13.00 Min. :1.000
Class :character 1st Qu.:31.00 1st Qu.:3.000
Mode :character Median :36.00 Median :4.000
Mean :35.93 Mean :3.813
3rd Qu.:40.00 3rd Qu.:5.000
Max. :56.00 Max. :6.000
Months_Inactive_12_mon Contacts_Count_12_mon Credit_Limit
Min. :0.000 Min. :0.000 Min. : 1438
1st Qu.:2.000 1st Qu.:2.000 1st Qu.: 2555
Median :2.000 Median :2.000 Median : 4549
Mean :2.341 Mean :2.455 Mean : 8632
3rd Qu.:3.000 3rd Qu.:3.000 3rd Qu.:11068
Max. :6.000 Max. :6.000 Max. :34516
Total_Revolving_Bal Avg_Open_To_Buy Total_Amt_Chng_Q4_Q1 Total_Trans_Amt
Min. : 0 Min. : 3 Min. :0.0000 Min. : 510
1st Qu.: 359 1st Qu.: 1324 1st Qu.:0.6310 1st Qu.: 2156
Median :1276 Median : 3474 Median :0.7360 Median : 3899
Mean :1163 Mean : 7469 Mean :0.7599 Mean : 4404
3rd Qu.:1784 3rd Qu.: 9859 3rd Qu.:0.8590 3rd Qu.: 4741
Max. :2517 Max. :34516 Max. :3.3970 Max. :18484
Total_Trans_Ct Total_Ct_Chng_Q4_Q1 Avg_Utilization_Ratio
Min. : 10.00 Min. :0.0000 Min. :0.0000
1st Qu.: 45.00 1st Qu.:0.5820 1st Qu.:0.0230
Median : 67.00 Median :0.7020 Median :0.1760
Mean : 64.86 Mean :0.7122 Mean :0.2749
3rd Qu.: 81.00 3rd Qu.:0.8180 3rd Qu.:0.5030
Max. :139.00 Max. :3.7140 Max. :0.9990 3 Data Cleaning
I dropped the variable Clientum which represents the
unique identifier for each customer`s account. ID variables should always
be excluded when building a machine learning model. Failure to do so,
would lead to inaccurate findings and over-fitting since the ID variable
will be used to uniquely predict each entry (Lantz, 2013).
bank<-Bank[,-1]Checking for missing values
sum(is.na(bank))[1] 0There were no missing values in our data set, fortunately.
Checking for duplicated values
sum(duplicated(Bank)==TRUE)[1] 0There are also no duplicated values.
4 Data Visualization
4.1 Categorical Variables
bank%>%ggplot(aes(x=Income_Category,fill=Attrition_Flag))+geom_bar(position = "fill")+labs(title="Income category",y="Percent",x="Income category")+scale_fill_brewer(palette = "Set2")+scale_y_continuous(breaks=seq(0,1,.2),label=percent)+theme_fivethirtyeight()+theme(axis.title.y = element_blank(),legend.title = element_blank(),plot.margin = unit(c(1,1,0,1),"cm"),axis.text = element_text(size = 9.5),plot.title = element_text(size=20,hjust = 0.5))

bank%>%ggplot(aes(x=Card_Category,fill=Attrition_Flag))+geom_bar(position = "fill")+theme_fivethirtyeight()+labs(title="Card category",y="Percent",x="Card category")+scale_fill_brewer(palette = "Set2")+scale_y_continuous(breaks=seq(0,1,.2),label=percent)+theme(axis.text = element_text(size = 9.5),plot.title = element_text(size=20,hjust=0.5))

bank%>%ggplot(aes(x=Education_Level,fill=Attrition_Flag))+geom_bar(position = "fill")+theme_fivethirtyeight()+labs(title="Education Level",y="Percent",x="Education level")+scale_fill_brewer(palette = "Set2")+scale_y_continuous(breaks=seq(0,1,.2),label=percent)+theme(axis.text = element_text(size = 9.5),plot.title = element_text(size=20,hjust=0.5))

bank%>%ggplot(aes(x=Gender,fill=Attrition_Flag))+geom_bar(position = "fill")+theme_fivethirtyeight()+labs(title="Gender",y="Percent",x="Gender")+scale_fill_brewer(palette = "Set2")+scale_y_continuous(breaks=seq(0,1,.2),label=percent)+theme(axis.text = element_text(size = 9.5),plot.title = element_text(size=20,hjust=0.5))

bank%>%ggplot(aes(x=Marital_Status,fill=Attrition_Flag))+geom_bar(position = "fill")+theme_fivethirtyeight()+labs(title="Marital Status",y="Percent",x="Marital")+scale_fill_brewer(palette = "Set2")+scale_y_continuous(breaks=seq(0,1,.2),label=percent)+theme(axis.text = element_text(size = 9.5),plot.title = element_text(size=20,hjust = 0.5))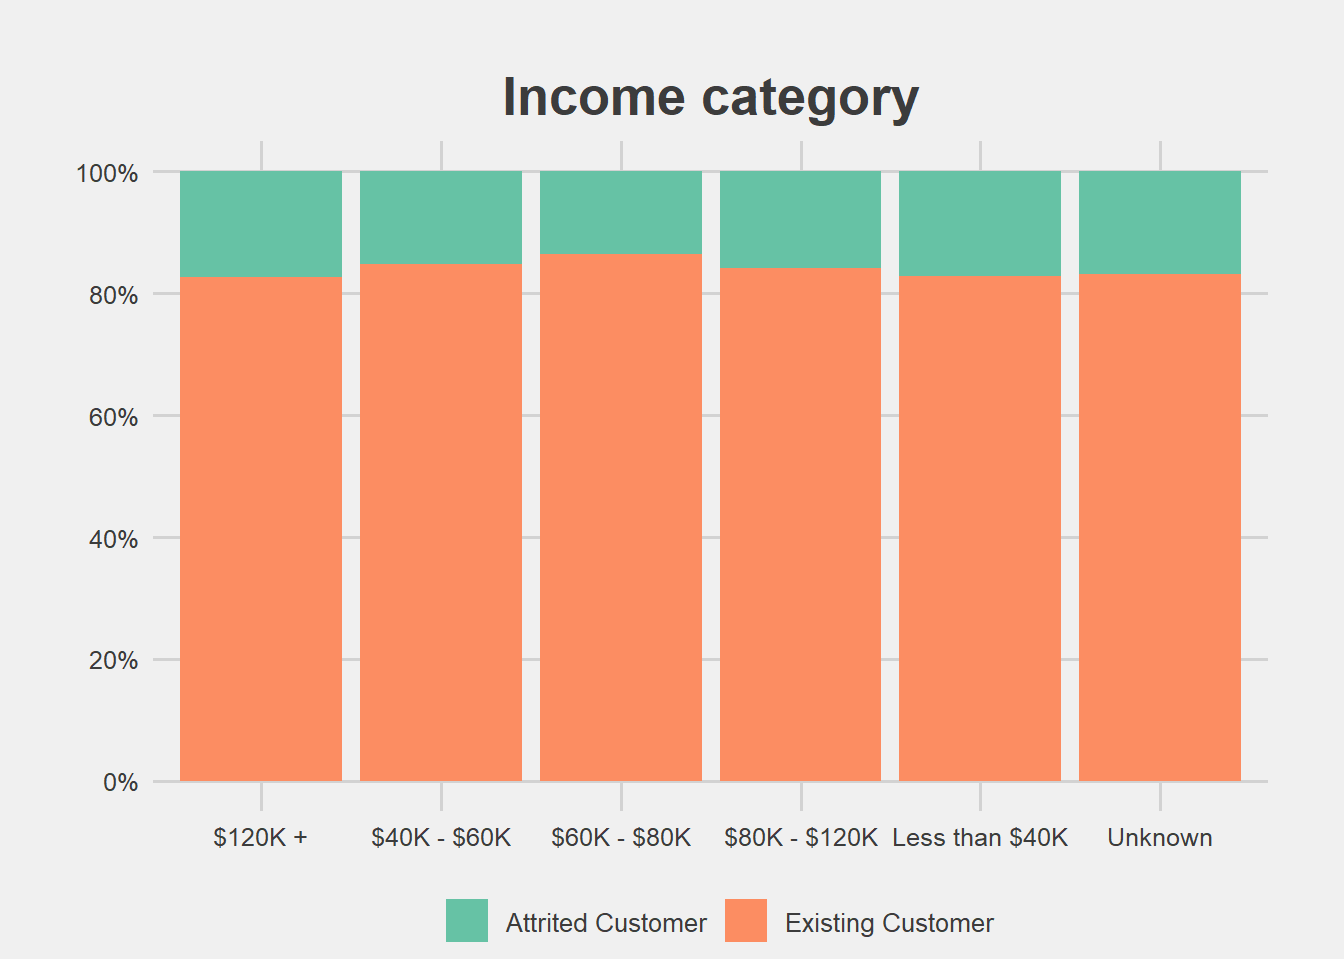
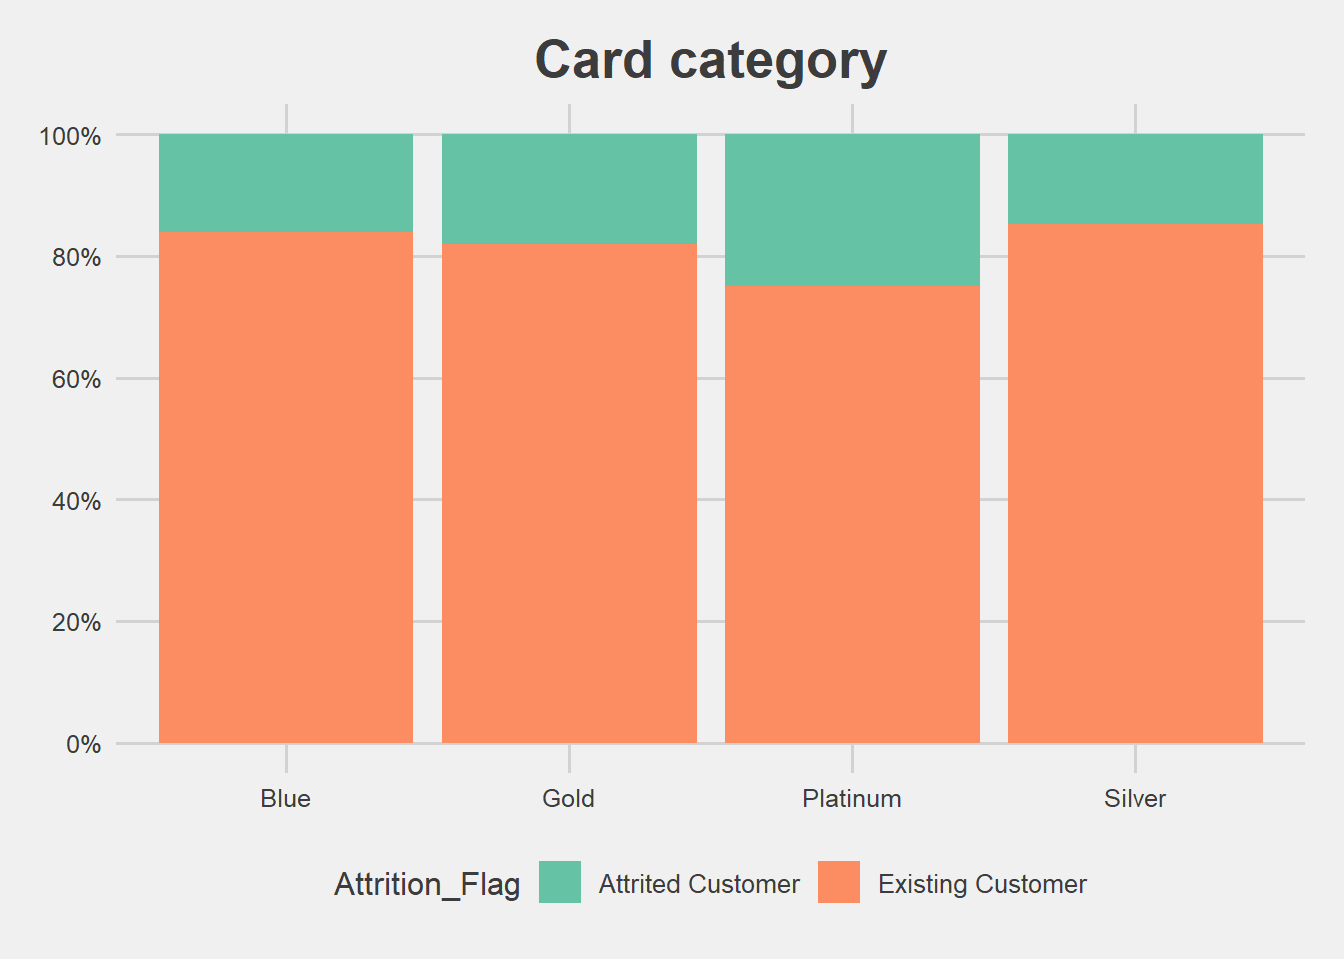

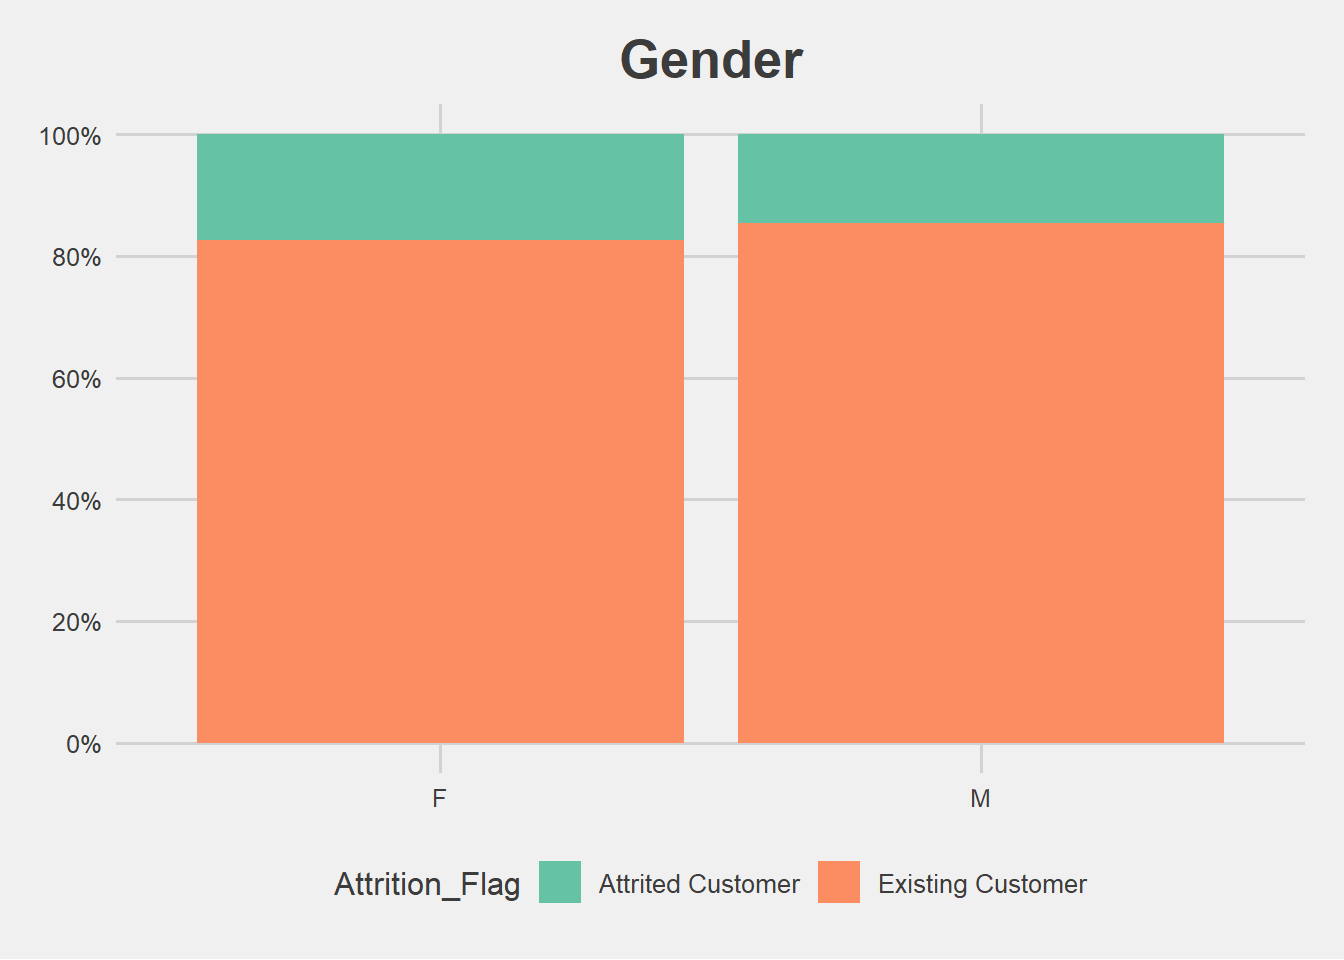
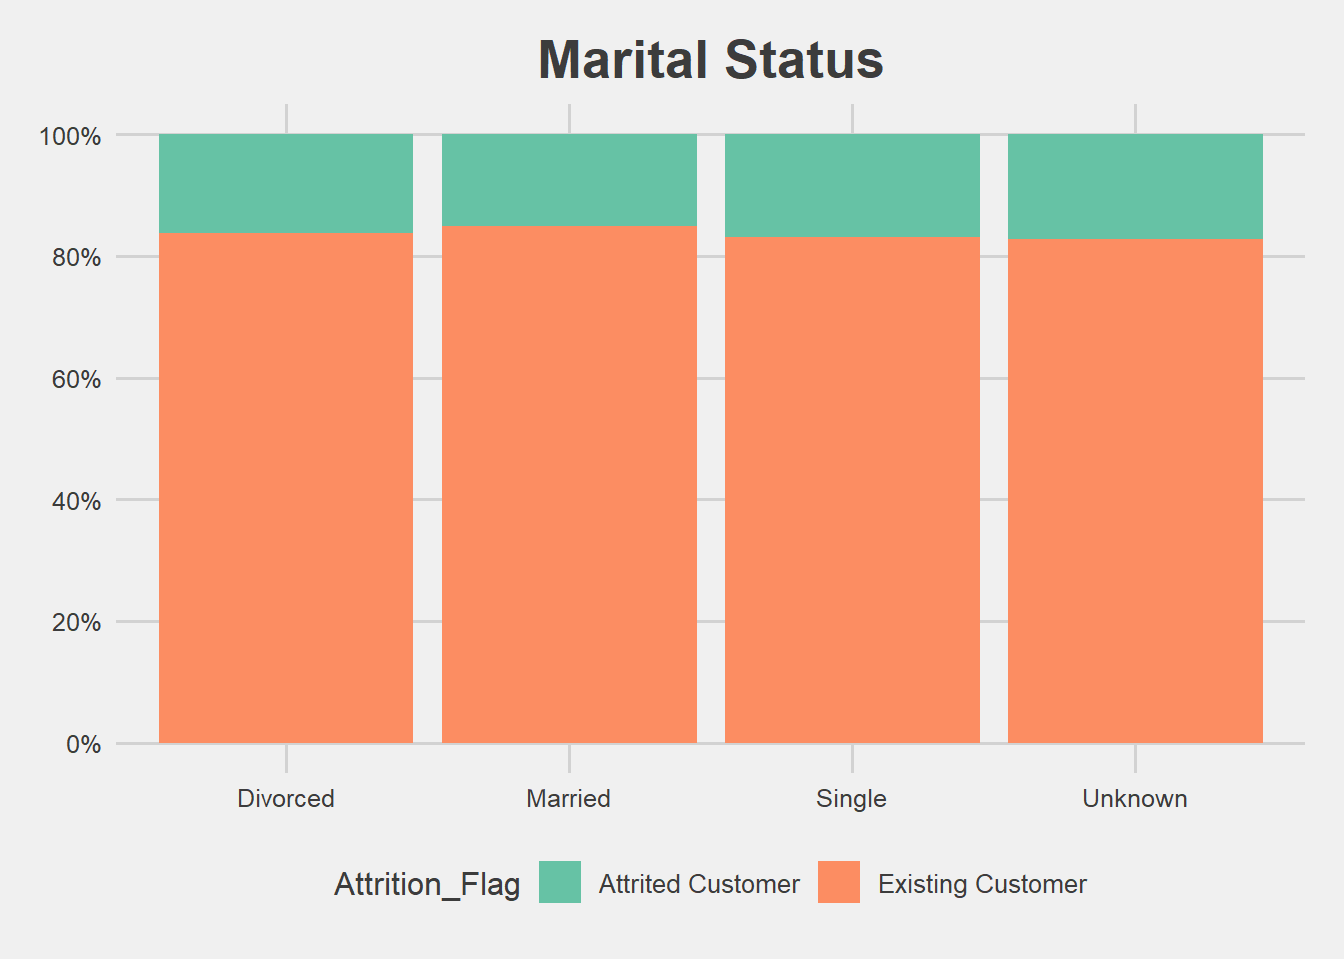
Looking at the graphs of each variable, it seems the level of churned vs non churned customers looks similar among the groups. This could be foreshadowing that none of our categorical variables are significant in predicting churn. However, there might be more we could find out if we only look at the number of churns for each variable.
4.2 Categorical Variables Looking Only at Attrition
bank%>%filter(Attrition_Flag=="Attrited Customer")%>%count(Education_Level)%>%rename("Education Level"=n)%>%treemap(bank2,index = c("Education_Level"),vSize = "Education Level",palette = "Set2")

bank%>%filter(Attrition_Flag=="Attrited Customer")%>%count(Card_Category)%>%rename("Card Category"=n)%>%treemap(bank2,index = c("Card_Category"),vSize = "Card Category",palette = "Set2")

bank%>%filter(Attrition_Flag=="Attrited Customer")%>%count(Gender)%>%rename("Gender."=n)%>%treemap(bank2,index = c("Gender"),vSize = "Gender.",palette = "Set2")

bank%>%filter(Attrition_Flag=="Attrited Customer")%>%count(Marital_Status)%>%rename("Marital Status"=n)%>%treemap(bank2,index = c("Marital_Status"),vSize = "Marital Status",palette = "Set2")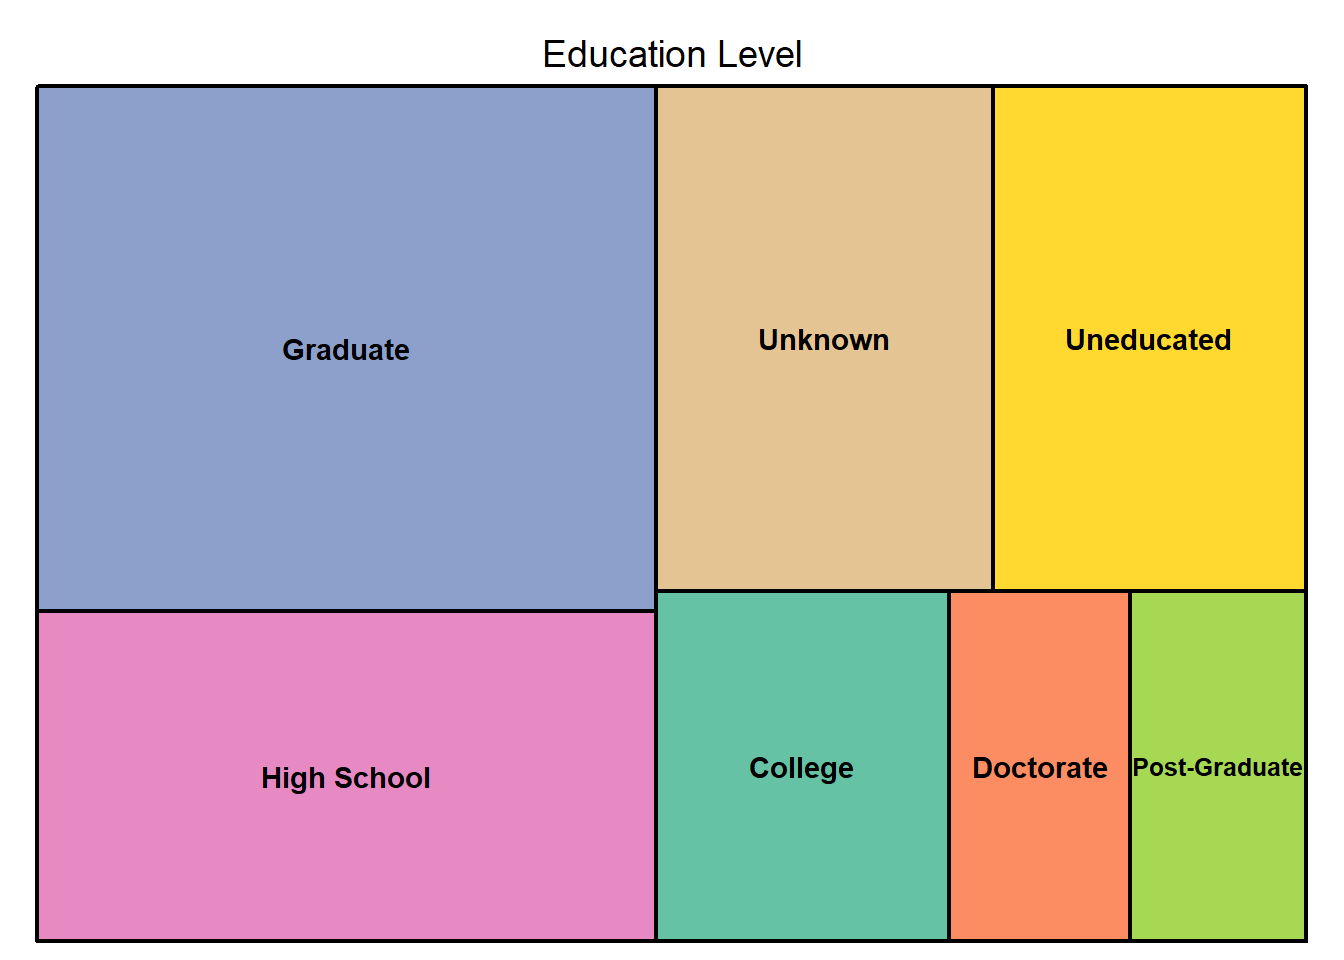

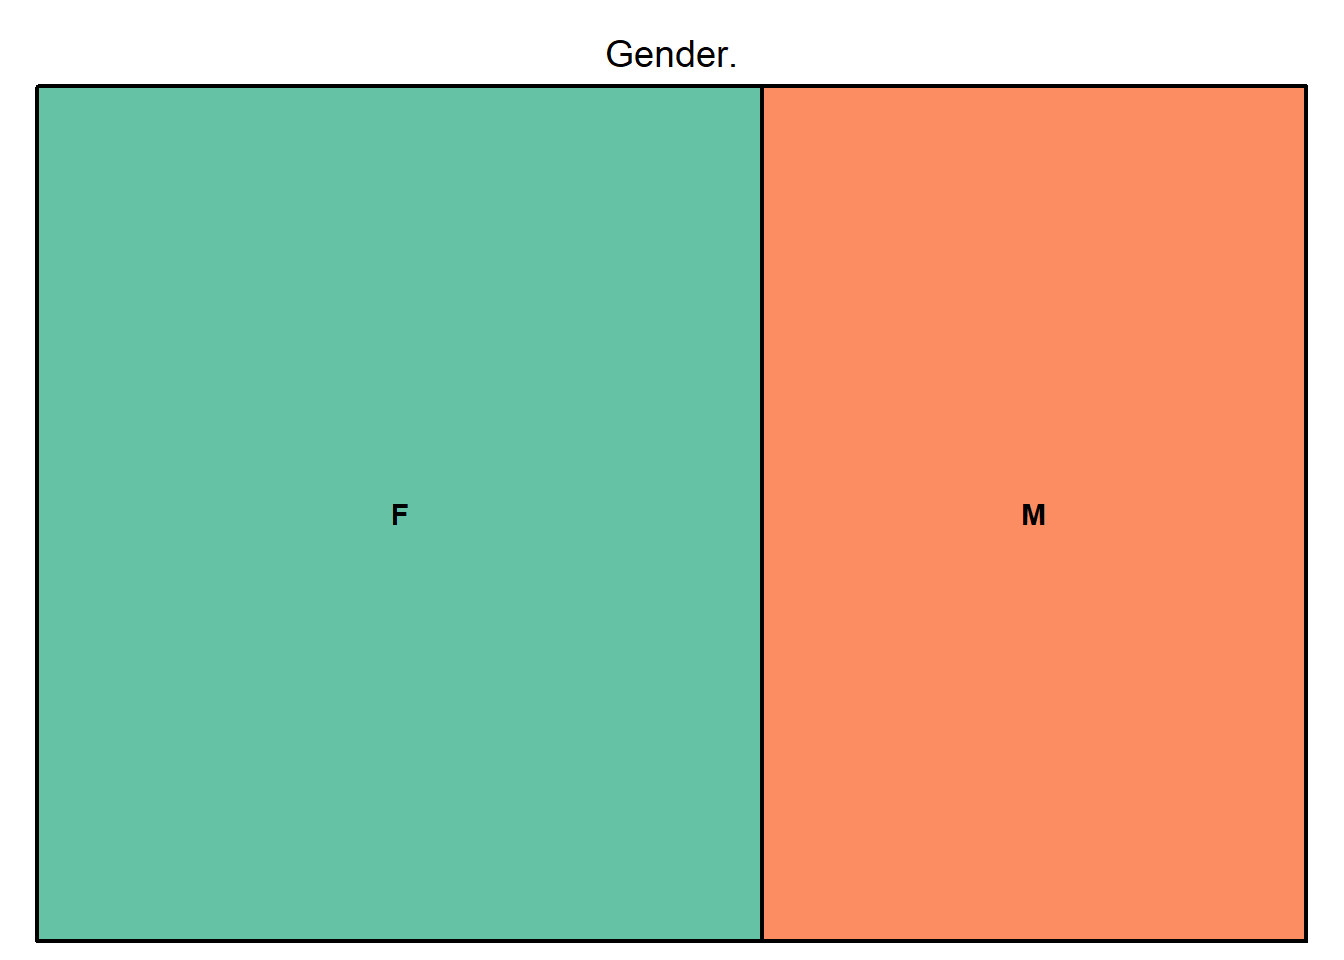
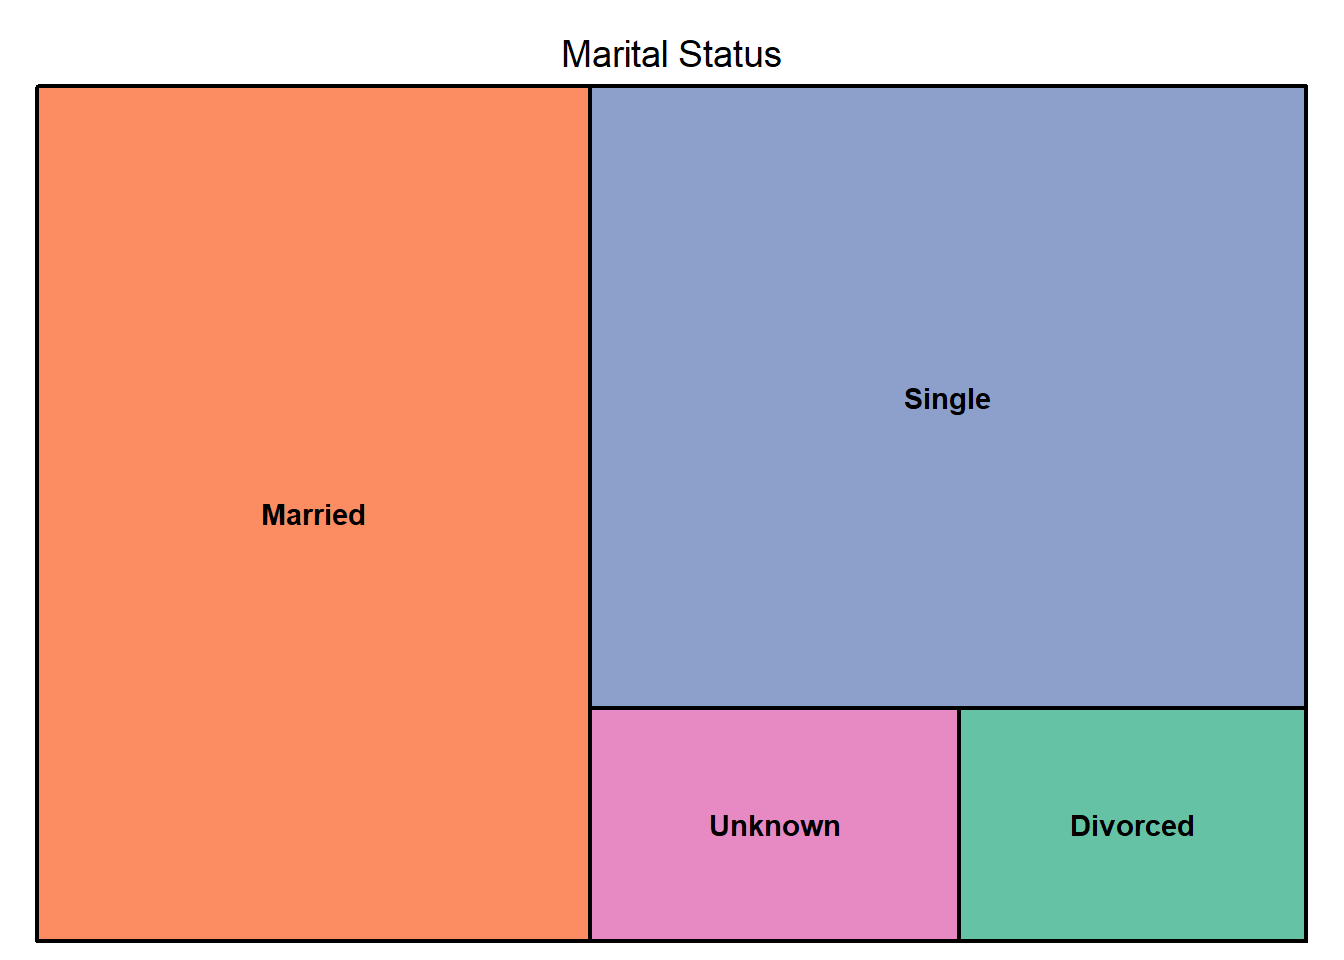
From the graphs above we can filter the following information.
Education level- Most of the credit card cancellations are from customers who have graduated and the lowest number of cancellations are from customers with a post doctorate.Card category- Most of the credit card cancellations are from customers with a blue card, while the lowest are from customers with a platinum card.Gender- Even though female customers seem to have more credit card cancellations, the difference between them and the male customers who have churned does not seem significant.Marital status- Most of the credit card cancellations are from married customers while the lowest are from divorced customers.
4.3 Spearman’s Correlation Plot Continuous Variables
The spearmans ranks correlation coefficient or spearman`s \(\rho\) is a non-parametric measure of rank correlation. It describes the relationship between two variables using a monotonic (a scenario in which the size of one variable increases as another variable either increases or decreases) function. We will use this co-efficient to show the relationship between our target variable and the continuous variables
We first store the continuous variables in one data set.
cont.variables<-bank%>%select(Attrition_Flag,Dependent_count,Total_Relationship_Count,Months_Inactive_12_mon ,Contacts_Count_12_mon,Credit_Limit,Total_Revolving_Bal,Total_Amt_Chng_Q4_Q1,Total_Trans_Amt,Total_Trans_Ct, Total_Ct_Chng_Q4_Q1,Customer_Age,Avg_Utilization_Ratio,Months_on_book,Avg_Open_To_Buy)Now we create a corrplot.
m<-cor(cont.variables,method='spearman')
corrplot(m,method="color",type = "full",addCoef.col = "black",number.cex = 0.50)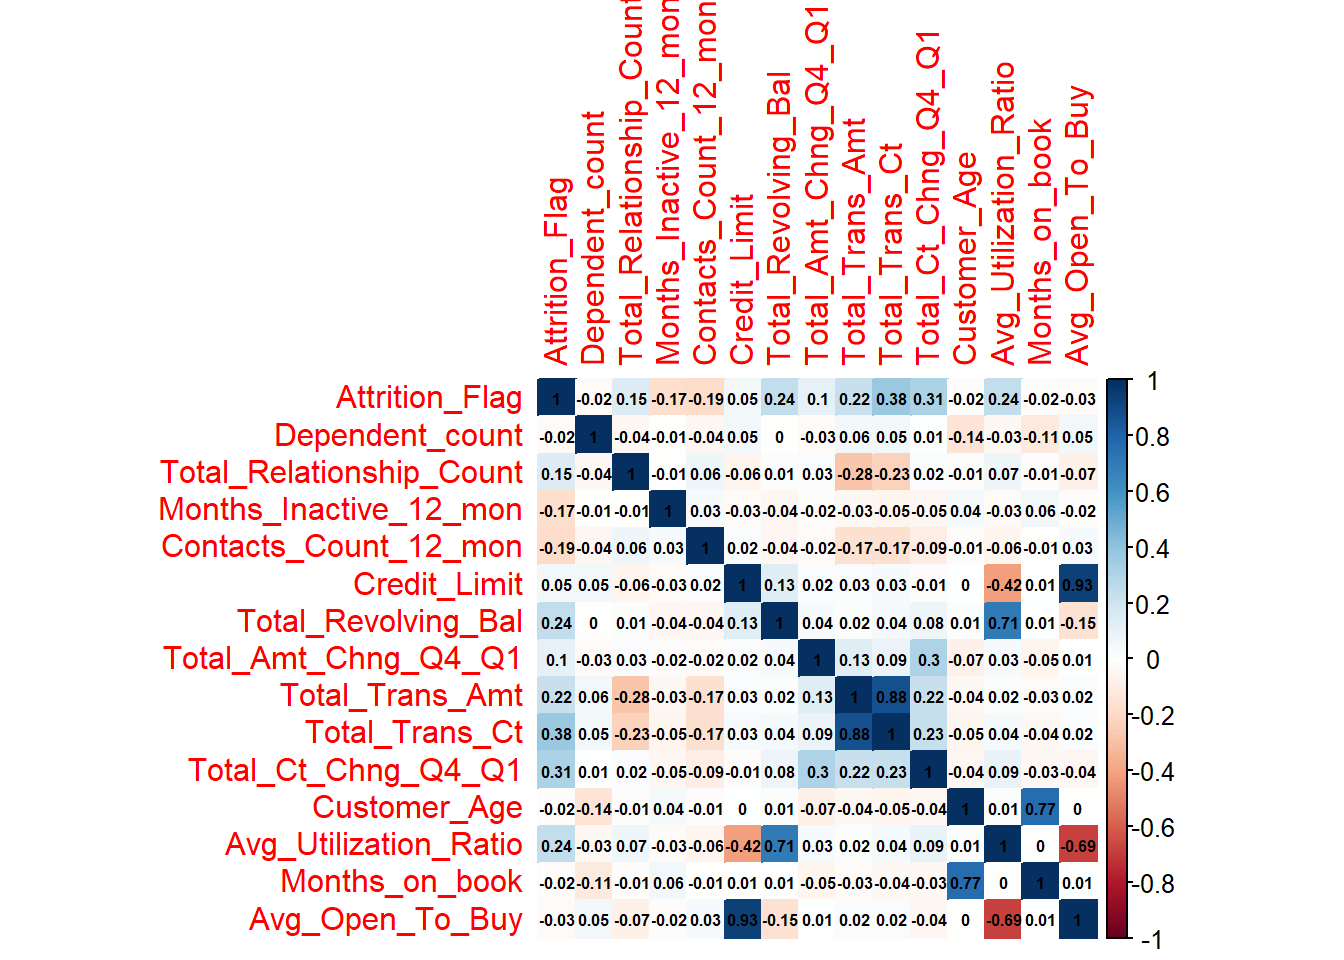
The variablesTotal_Relationship_Count,
Total_Revolving_Bal, Total_Trans_Ct,
Total_Ct_Chng_Q4_Q1, and Avg_Utilization_Rati0
exhibit a positive monotonic association with our target variable. This
might indicate that they are significant in predicting churn. While
Contact_Count_12_mon and
Months_Inactive_12_mon exhibit a negative monotonic
association with our target variable. This might also indicate that they
are significant in predicting churn. The others do not exhibit a strong
relationship with our target variable.
5 Feature and Target Engineering
We now perform feature and target engineering.
Feature and target engineering refer to methods that alter (addition, deletion or transformation) raw data into features that better represent the underlying goal of the predictive model so as to better train our algorithm (Boehmke & Greenwell, 2019).
5.1 Dummy Coding
We are changing the values in the Attrition_Flag field
which is our target variable to 1 if it is an existing customer, and 0
if it is a churned customer.
df<-bank%>%mutate(Attrition_Flag=if_else(Attrition_Flag=="Existing Customer",1,0))%>%mutate_if(is.character,factor)5.2 Feature Importance
Feature importance refers to methods that assigns a score to input features based on how good their predictive power is. We will use the Random Forest algorithm to perform feature importance.
model<-lm(Attrition_Flag~., method="rf",data=df)

var<-data.frame(var=row.names(varImp(model)),Import=varImp(model)$Overall)
Storing the most important variables in one data set.
final<-filter(var,Import>= 0.1)$Varnames(final) [1] "Attrition_Flag" "Dependent_count"
[3] "Total_Relationship_Count" "Months_Inactive_12_mon"
[5] "Contacts_Count_12_mon" "Credit_Limit"
[7] "Total_Revolving_Bal" "Total_Amt_Chng_Q4_Q1"
[9] "Total_Trans_Amt" "Total_Trans_Ct"
[11] "Total_Ct_Chng_Q4_Q1" "Customer_Age"
[13] "Avg_Utilization_Ratio" "Months_on_book"
[15] "Avg_Open_To_Buy" - As we can see above from our feature engineering, most of the significant variables were transaction variables.
5.3 Splitting the Data into the Training Set and Test Set.
Since we are dealing with a classification problem that also happens to be severely imbalanced we will use stratified sampling to split the data.
set.seed(1337)

train1<-createDataPartition(final$Attrition_Flag,p=0.7,times=1,list=F)
train<-final[train1,]
test<-final[-train1,]
5.4 Dealing with Class Imbalance Using SMOTE
Our target variable was very imbalanced. Existing customers only make up 84% of the training data while those who have churned make up only 16%. We use SMOTE to deal with this.
smote<-SMOTE(as.data.frame(train[,-14]),train$Attrition_Flag,K=5)
train_smote<-smote$data
5.4.1 Before and After Applying SMOTE Visualization
prop.table(table(train_smote$class))
        0         1
0.4754829 0.5245171 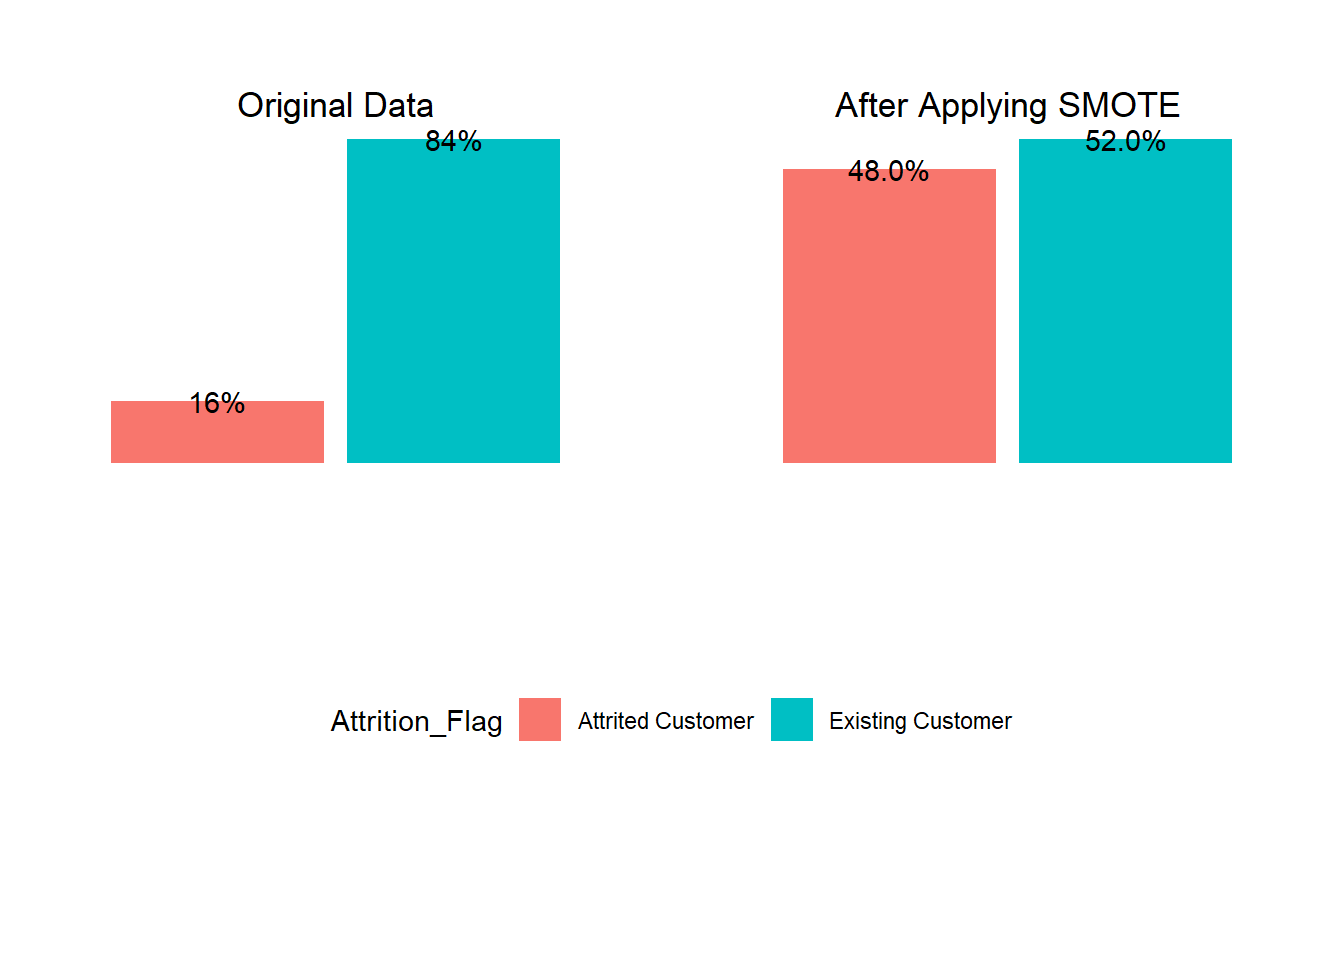
6 Fitting Our XGBOOST Model
control<-trainControl(method = "cv",number = 5)

grid<-expand.grid(max_depth=17,
                  nrounds=172,
                  eta=0.4,
                  gamma=0.2,
                  colsample_bytree=0.8,
                  min_child_weight=0.6,
                  subsample=0.8)

xgbm.tune=train(
  x=select(train_smote,-c("class")),
  y=train_smote$class,
  method="xgbTree",
  tunegrid=grid,
  metric="Kappa",
  verbose=FALSE,
  trControl=control,

  )
6.1 Evaluating Our Model
predict_xgm=predict(xgbm.tune,select(test, c(-"class")))
confusionMatrix(predict_xgm,test$class)
Confusion Matrix and Statistics
Reference
Prediction 0 1
0 480 35
1 59 2464
Accuracy : 0.9691
95% CI : (0.9623, 0.9749)
No Information Rate : 0.8226
P-Value [Acc > NIR] : < 0.0000000000000002
Kappa : 0.8921
Mcnemar's Test P-Value : 0.01768
Sensitivity : 0.8905
Specificity : 0.9860
Pos Pred Value : 0.9320
Neg Pred Value : 0.9766
Prevalence : 0.1774
Detection Rate : 0.1580
Detection Prevalence : 0.1695
Balanced Accuracy : 0.9383
'Positive' Class : 0
- From the confusion matrix 2944 values from our test set were correctly predicted (TN(true negative), TP(true positive)), while 94 were wrongly predicted (FN(false negative),FP(false positive)).
- Our model ended up with an accuracy of 96.91%. This is very accurate as expected since our model predicted most values correctly. It also performed well on other metrics such as sensitivity, specificity and kappa.
References
Boehmke, B., & Greenwell, B. (2019). Hands-on machine learning with R. Chapman and Hall/CRC.
Lantz, B. (2013). Machine learning with R. Packt publishing ltd, 77.